Coding Analytics
The Coding Analytics section in Clinical Analytics Scorecards helps hospitals find opportunities for improving coding by identifying potential over-and under-coding. Multiple search parameters and three levels of analysis provide analysts with a variety of ways to drill into opportunities. The analytic can also identify under- and over-coding of secondary diagnosis codes to focus clinical documentation improvement efforts.
NOTE: You can add the Coding Analytics section to any scorecard; see Customize scorecards for more information.
Centers for Medicare and Medicaid Services (CMS) uses Medicare Severity Diagnosis Related Groups (MS-DRGs) for reimbursement based upon a case mix weight assigned to each MS-DRG. CMS has a list of MS-DRG weights that determines hospital payments based on complications/comorbidities (CC) and major complications/comorbidities (MCC). The weights are available on the CMS website. This section can be used to help maximize reimbursements for Medicare patients.
NOTE: See Use Case - Coding Analytics for a sample of this section's analytics in action.
Section settings
Once you select your Report Type (see the following Report types for details of each), you have several Settings options for this section. As with most Clinical Analytics Scorecards sections, you can save your settings as a section-specific template; in this case, a Coding Analytics template.
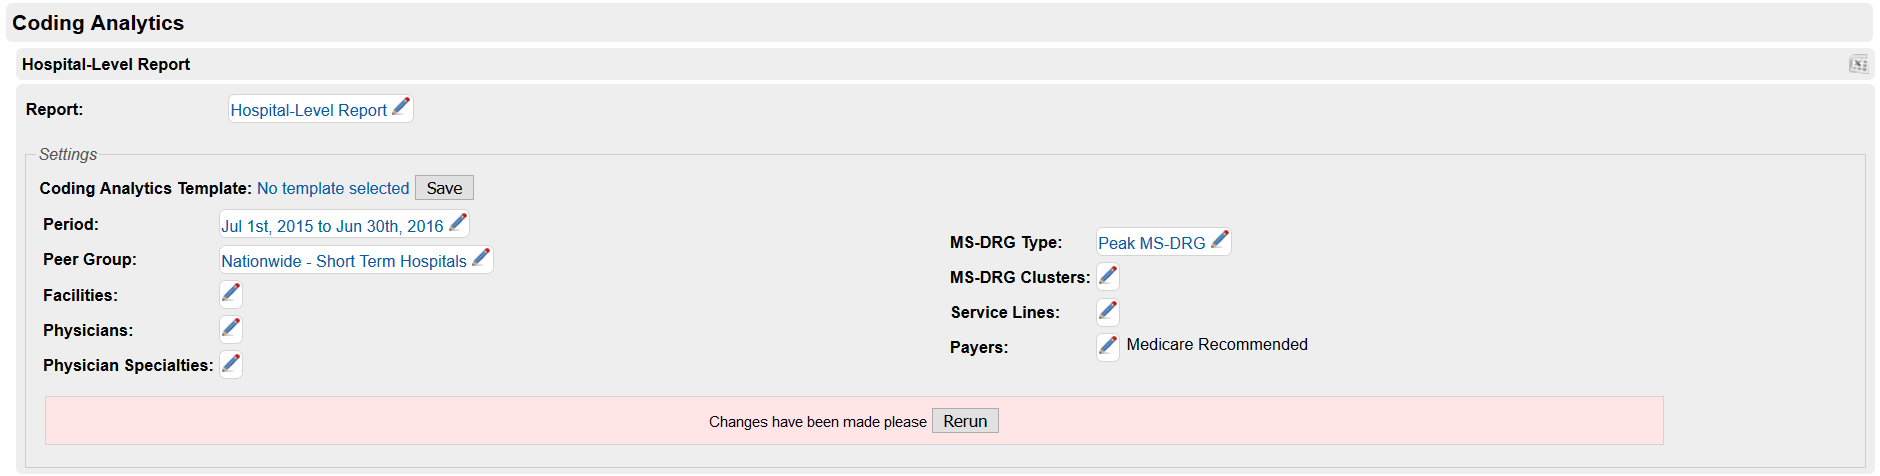
Savable settings options include:
- Period
- Peer Group
- Facilities
- Physicians
- Physician Specialties
- MS-DRG Type
- For clients providing MS-DRG, select between using the Client MS-DRG or MS-DRG (assigned by Clinical Analytics) for each encounter.
- MS-DRG Clusters
- See MS-DRG clusters for a full list.
- Service Lines
- Payers
- We recommend selecting Medicare, as this section's analytic power is built on the MS-DRG weights provided by CMS and used for reimbursement.
Click the pencil icon for each setting to modify your selections.

Report types
The Coding Analytics section offers six different reports on three levels, plus an additional standalone report.
- Top-Level reports include:
- The Hospital-level report gives an overview. It lists totals for the MS-DRG clusters based upon potential over- or under-coding.
- The Physician report shows cases grouped by physician.
- The Specialty report groups cases by specialty.
- The Overall Diagnosis report groups patients by secondary diagnoses, allowing for a hospital-wide analysis; this is a standalone report with no drilling capabilities.
- The Cluster report lists MS-DRG clusters and their related case mix and reimbursement information. You can drill to the Cluster Report from any of the Top-Level reports listed above by clicking a hyperlinked value in the table. From the Cluster Report, you can drill to two further report types:
- The Diagnosis report lists the secondary diagnosis frequency and potential over- and under-coding of secondary diagnoses.
- The Patient Detail report lists each patient individually with physician and reimbursement information with the opportunity to drill into patient-level data.
Top-Level reports
Hospital-Level report
The Hospital-Level Report is the default Report type selection when you open the Coding Analytics section. This Report type offers a hospital-wide analysis compared to your selected peer group.
Understand the data table
See the following sample data table from a Hospital-Level report.
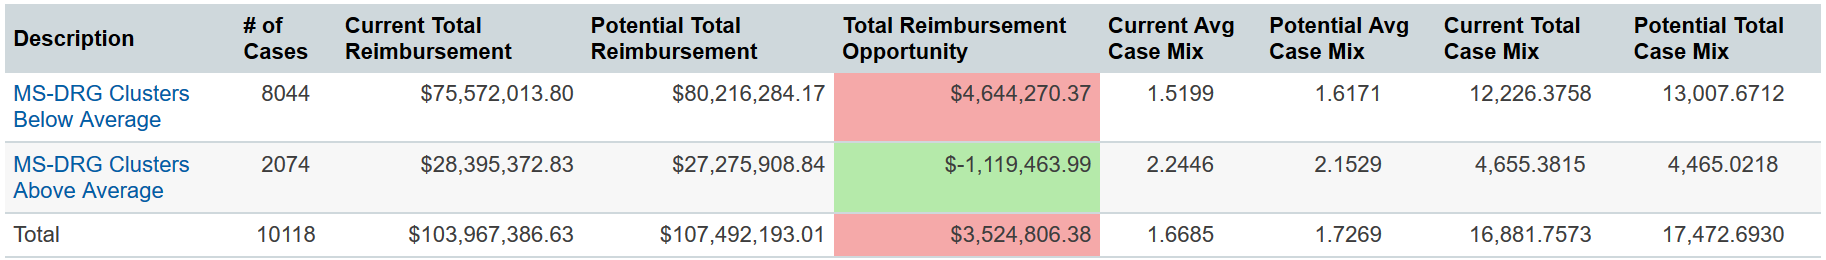
Click a blue linked column description (either MS-DRG Clusters Below Average or MS-DRG Clusters Above Average) to drill into the Cluster report.
Rows
The data table always has three rows: MS-DRG Clusters Below Average, MS-DRG Clusters Above Average, and Total.
| Row | Description |
|---|---|
|
MS-DRG Clusters Below Average |
Displays information about all MS-DRG Clusters for which the hospital had fewer cases with CCs and/or MCCs than the benchmark. |
|
MS-DRG Clusters Above Average |
Displays information about all MS-DRG Clusters for which the hospital had more cases with CCs and/or MCCs than the benchmark. |
|
Total |
Displays totals for each column. |
Columns
| Column | Description |
|---|---|
|
Description |
MS-DRG Clusters Below Average, MS-DRG Clusters Above Average, or Total |
|
# Number of Cases |
Number of encounters in the group listed in the Description column |
|
Current Total Reimbursement |
Lists the approximate total reimbursement your facility can expect to get from Medicare for the cases in the group; note that this does not include reimbursement for outliers, special reimbursements, or cases that were discharged to home care, SNF, or another acute care facility that resulted in reimbursement reductions. |
|
Potential Total Reimbursement |
Lists the potential approximate reimbursement your facility could get if the case mix was the same as the benchmark; note that this does not include reimbursement for outliers, special reimbursements, or cases that were discharged to home care, SNF, or another acute care facility that resulted in reimbursement reductions. |
|
Total Reimbursement Opportunity |
The difference between your current Medicare reimbursement (Current Total Reimbursement column) and the benchmark Medicare reimbursement (Potential Total Reimbursement column). |
|
Current Average Case Mix |
Total Current Case Mix divided by the Number of Cases; this number shows the average case mix weight per encounter. |
|
Potential Average Case Mix |
Potential Case Mix Total divided by the Number of Cases; this number shows what the average MS-DRG weight per encounter could be if your facility matched the benchmark. |
|
Current Total Case Mix |
Sum of MS-DRG weights |
|
Potential Total Case Mix |
Sum of MS-DRG weights for all cases in the cluster if the distribution of cases was the same as the benchmark; this is calculated for each cluster individually and rolled up to include all the clusters in the group. |
Physician report
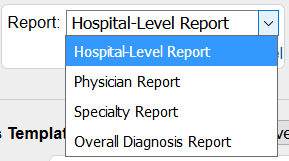
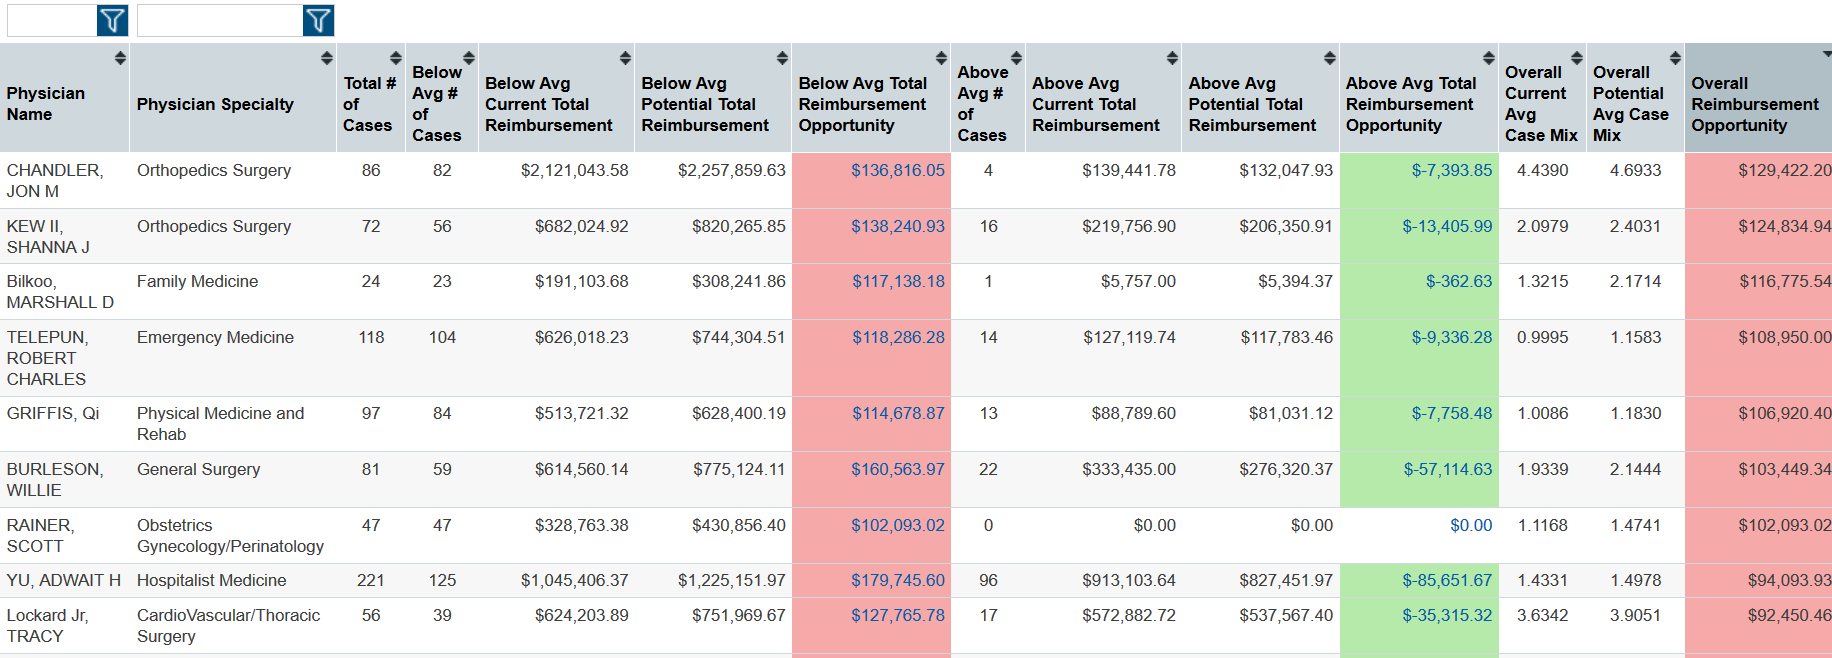
You can switch to the Physician Report from the Report Selection dropdown on the parameter menu. The section loads an analysis showing cases grouped by physician.
Understand the data table
Click a hyperlinked reimbursement opportunity value to drill into the Cluster report.
See the following sample data table.
Columns
| Column | Description |
|---|---|
|
Physician Name |
The name of the physician |
|
Physician Specialty |
The physician’s specialty |
|
Total # of Cases |
The total number of cases that the physician had |
|
Below Avg # of Cases |
The number of cases for which the physician performed below the peer group |
|
Below Avg Current Total Reimbursement |
Lists the total reimbursement your facility can expect to get from Medicare for the cases in the below-average group |
|
Below Avg Potential Total Reimbursement |
Lists the potential reimbursement your facility could get if the case mix for the below-average physician cases was the same as the benchmark |
|
Below Avg Total Reimbursement Opportunity |
The difference between your current Medicare reimbursement and your potential Medicare reimbursement for the cases in the below-average group |
|
Above Avg # of Cases |
The number of cases for which the physician performed above the peer group |
|
Above Avg Current Total Reimbursement |
Lists the total reimbursement your facility can expect to get from Medicare for the cases in the above-average group |
|
Above Avg Potential Total Reimbursement |
Lists the potential reimbursement your facility could get if the case mix for the above-average physician cases was the same as the benchmark in the above-average group |
|
Above Avg Total Reimbursement Opportunity |
The difference between your current Medicare reimbursement and your potential Medicare reimbursement, for the above-average group |
|
Overall Current Avg Case Mix |
Total case mix divided by the total number of cases; this number shows the average case mix weight per encounter for each physician |
|
Overall Potential Avg Case Mix |
Potential Case Mix Total divided by the Number of Cases; this shows what the average case mix weight per encounter could be if the physician matched the benchmark |
|
Overall Reimbursement Opportunity |
Below Average Total Reimbursement Opportunity plus Above Average Total Reimbursement Opportunity |
Specialty report
You can switch to the Specialty report from the dropdown in the Hospital-Level report. The section loads an analysis showing cases grouped by physician specialty.
Understand the data table
Click a hyperlinked reimbursement opportunity value to drill into the Cluster report.
See the following sample data table.
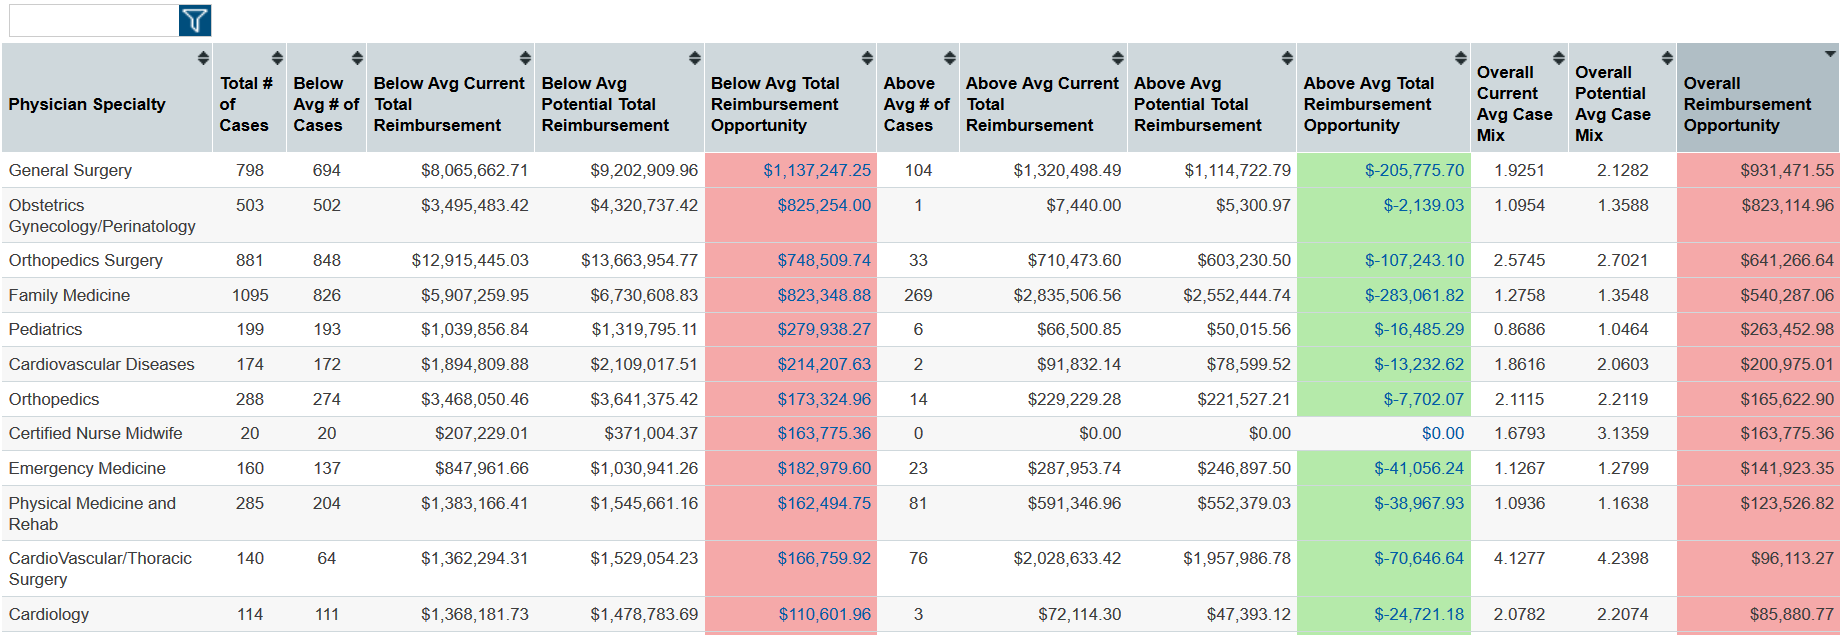
Columns
| Column | Description |
|---|---|
|
Physician Specialty |
The specialty |
|
Total # of Cases |
The total number of encounters seen by physicians of that specialty |
|
Below Avg # of Cases |
The number of cases for which the facility performed below the peer group |
|
Below Avg Current Total Reimbursement |
Lists the total reimbursement your facility can expect to get from Medicare for the cases in the group |
|
Below Avg Potential Total Reimbursement |
Lists the potential reimbursement your facility could get if the case mix was the same as the benchmark |
|
Below Avg Total Reimbursement Opportunity |
The difference between your current Medicare reimbursement and the benchmark Medicare reimbursement, with the facility case mix adjusted to match the benchmark |
|
Above Avg # of Cases |
The number of cases for which the facility performed above the peer group |
|
Above Avg Current Total Reimbursement |
Lists the total reimbursement your facility can expect to get from Medicare for the cases in the above-average group |
|
Above Avg Potential Total Reimbursement |
Lists the potential reimbursement your facility could get if the case mix was the same as the benchmark in the above-average group |
|
Above Avg Total Reimbursement Opportunity |
The difference between your current Medicare reimbursement and the benchmark Medicare reimbursement, with the facility case mix adjusted to match the benchmark in the above-average group |
|
Overall Current Average Case Mix |
Total case mix divided by the total number of cases; this number shows the average case mix weight per encounter for each physician |
|
Overall Potential Average Case Mix |
Potential Case Mix Total divided by the Number of Cases; this shows what the average MS-DRG weight per encounter could be if your facility matched the benchmark |
|
Overall Reimbursement Opportunity |
Below Average Total Reimbursement Opportunity plus Above Average Total Reimbursement Opportunity |
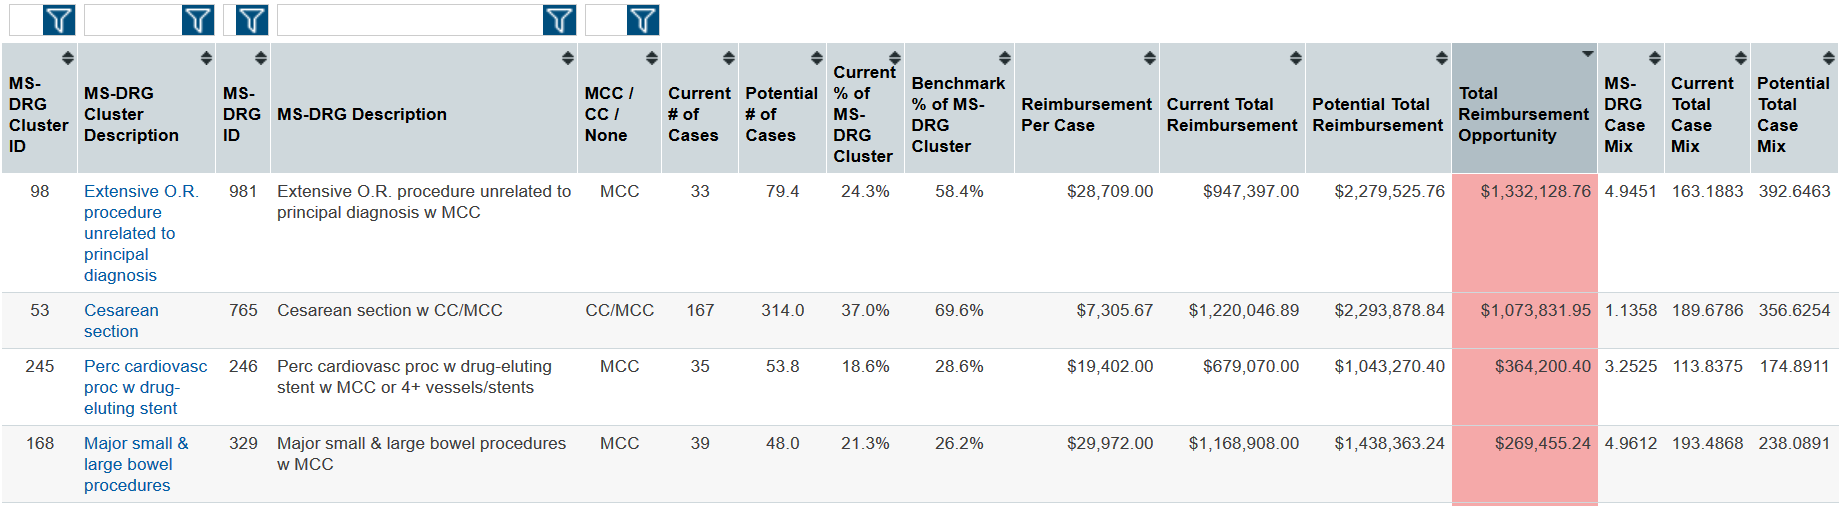
Cluster report
Click hyperlinked values in the Top-level reports to reach the Cluster report.
The Cluster report lists many of the same measurements as the high-level reports, broken down by individual MS-DRG clusters (for example, splenectomies, operating room procedures for obesity, rehabilitation, and so on).
Understand the data table
The Cluster report menu offers the option to view MS-DRGs individually or keep them in clusters.
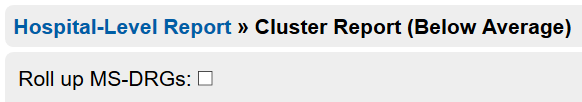
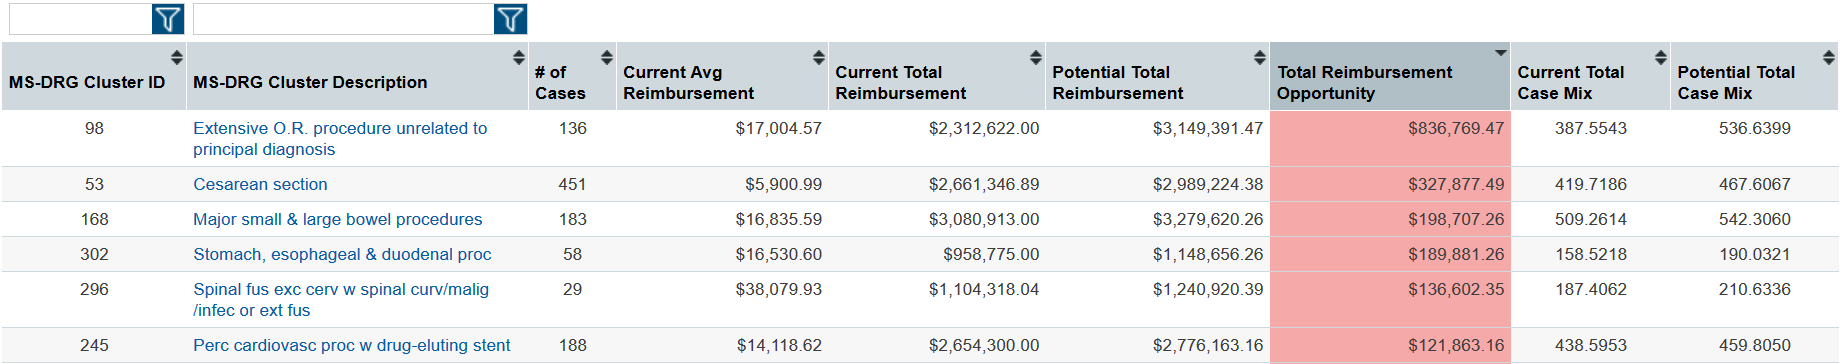
The default is to list the MS-DRGs individually. If you check the box and rerun the search, the table shows information aggregated by MS-DRG Cluster.
- Here is an example of a table with individual MS-DRGs listed (not aggregated by MS-DRG Cluster):
- Here is an example of a table with MS-DRGs rolled up into clusters:
Click an MS-DRG cluster description in the second column to drill into the two low-level reports, the Diagnosis report and the Patient Detail report.
Columns
Columns in italics display in the table when the MS-DRGs are not rolled up into clusters.
| Column | Description |
|---|---|
| MS-DRG Cluster ID | Cluster ID number; see MS-DRG clusters for more information |
| MS-DRG Cluster Description | Cluster description |
| MS-DRG ID | MS-DRG ID number |
| MS-DRG Description | MS-DRG description |
| MCC/CC/None | Lists whether the MS-DRG has complications or comorbidities (CC), major complications or comorbidities (MCC), or neither |
| # of Cases/Current # of Cases | Number of encounters in the cluster/DRG |
| Potential # of Cases | This shows the expected number of cases if the distribution of cases was the same as the benchmark |
| Current % of MS-DRG Cluster | Shows how much of the cluster consists of the specific MS-DRG for the facility |
| Benchmark % of MS-DRG Cluster | Shows how much of the cluster consists of the specific MS-DRG for the benchmark |
| Current Avg Reimbursement/Reimbursement per Case | Average approximate reimbursement per case (displays on rolled-up table only); note that this does not include reimbursement for outliers, special reimbursements, or cases that were discharged to home care, SNF, or another acute care facility that resulted in reimbursement reductions |
| Current Total Reimbursement | Current Avg Reimbursement or Reimbursement per Case multiplied by the number of cases |
| Potential Total Reimbursement | Lists the potential approximate reimbursement your facility could get if the case mix was the same as the benchmark; note that this does not include reimbursement for outliers, special reimbursements, or cases that were discharged to home care, SNF, or another acute care facility that resulted in reimbursement reductions |
| Total Reimbursement Opportunity | Potential total reimbursement minus the current facility reimbursement; a red box means your facility is getting less reimbursement than the benchmark, and green means it is getting more reimbursement |
| MS-DRG Case Mix | The MS-DRG weight assigned to the particular MS-DRG code |
| Current Total Case Mix | Sum of MS-DRG weights for all cases in the cluster or MS-DRG |
| Potential Total Case Mix | Sum of MS-DRG weights for all cases in the cluster if the distribution of cases was the same as the benchmark |
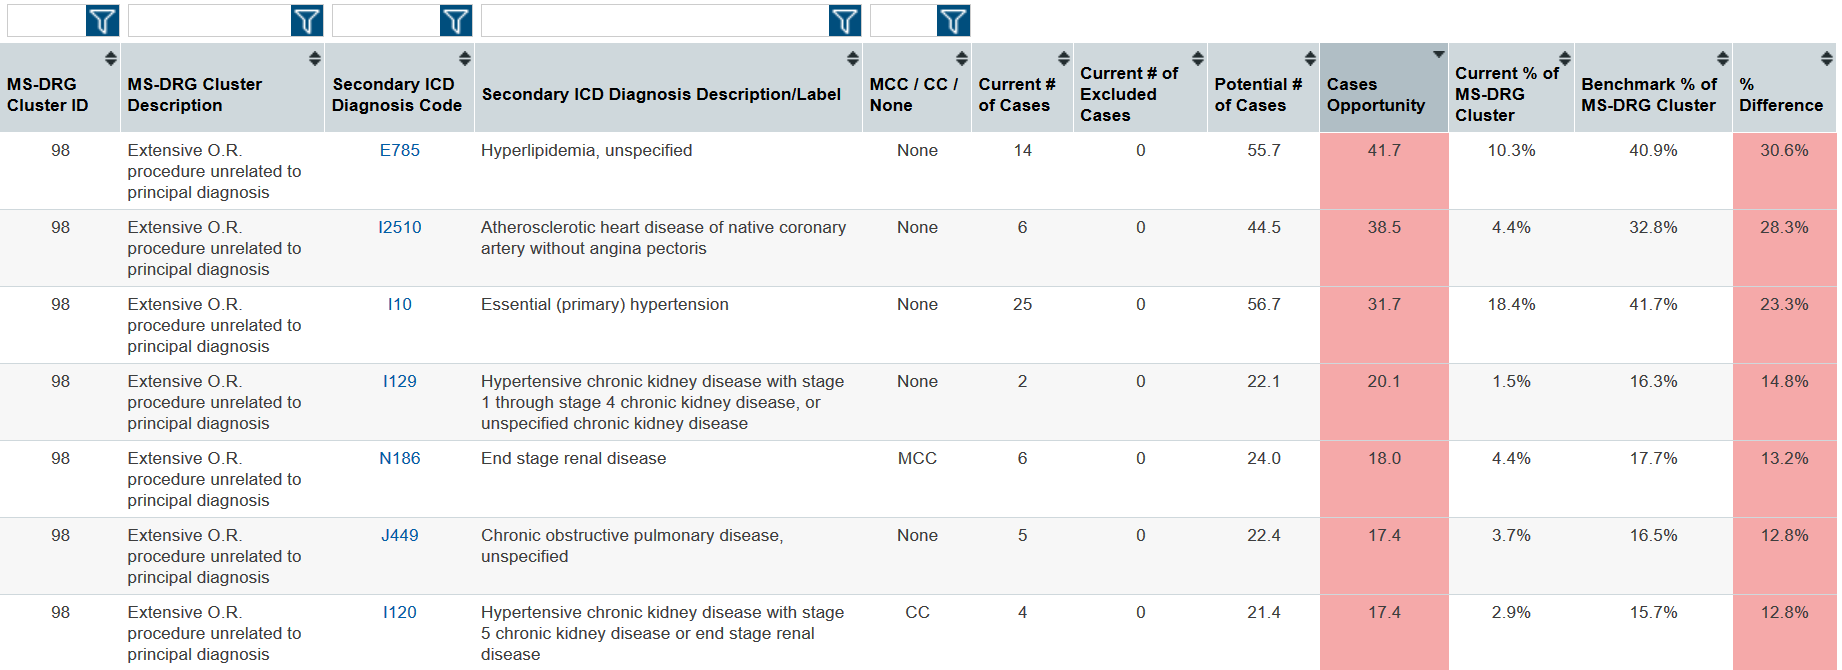
Diagnosis report
Click an MS-DRG cluster description in the Cluster report to reach the Diagnosis report. The Diagnosis report lists cases in each MS-DRG cluster by secondary diagnosis. Clicking a hyperlinked Secondary Diagnosis Code shows the Overall Diagnosis report.
Understand the data table
See the following sample data table.
Columns
| Column | Description |
|---|---|
|
MS-DRG Cluster ID |
Cluster ID number; see MS-DRG clusters for more information |
|
MS-DRG Cluster Description |
Cluster description |
|
Secondary ICD Diagnosis Code |
Secondary ICD Diagnosis Code |
|
Secondary ICD Diagnosis Description/Label |
Secondary ICD Diagnosis Code Description |
|
MCC/CC/None |
Lists whether the MS-DRG has complications or comorbidities (CC), major complications or comorbidities (MCC), or neither |
|
Current # of Cases |
Number of encounters in the cluster with that particular secondary diagnosis code |
|
Current # of Excluded Cases |
Number of secondary diagnoses excluded because of the principal diagnosis, according to the Medicare reimbursement rules |
|
Current % of MS-DRG Cluster |
Shows how much of the cluster consists of the specific secondary diagnosis for the facility |
|
Benchmark % of MS-DRG Cluster |
Shows how much of the cluster consists of the specific secondary diagnosis for the benchmark |
|
% Difference |
The difference between the Benchmark Percent of MS-DRG Cluster and the Current Percent of MS-DRG Cluster, displayed as a percent |
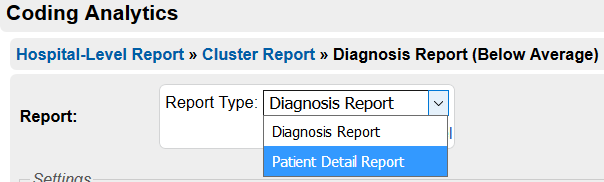
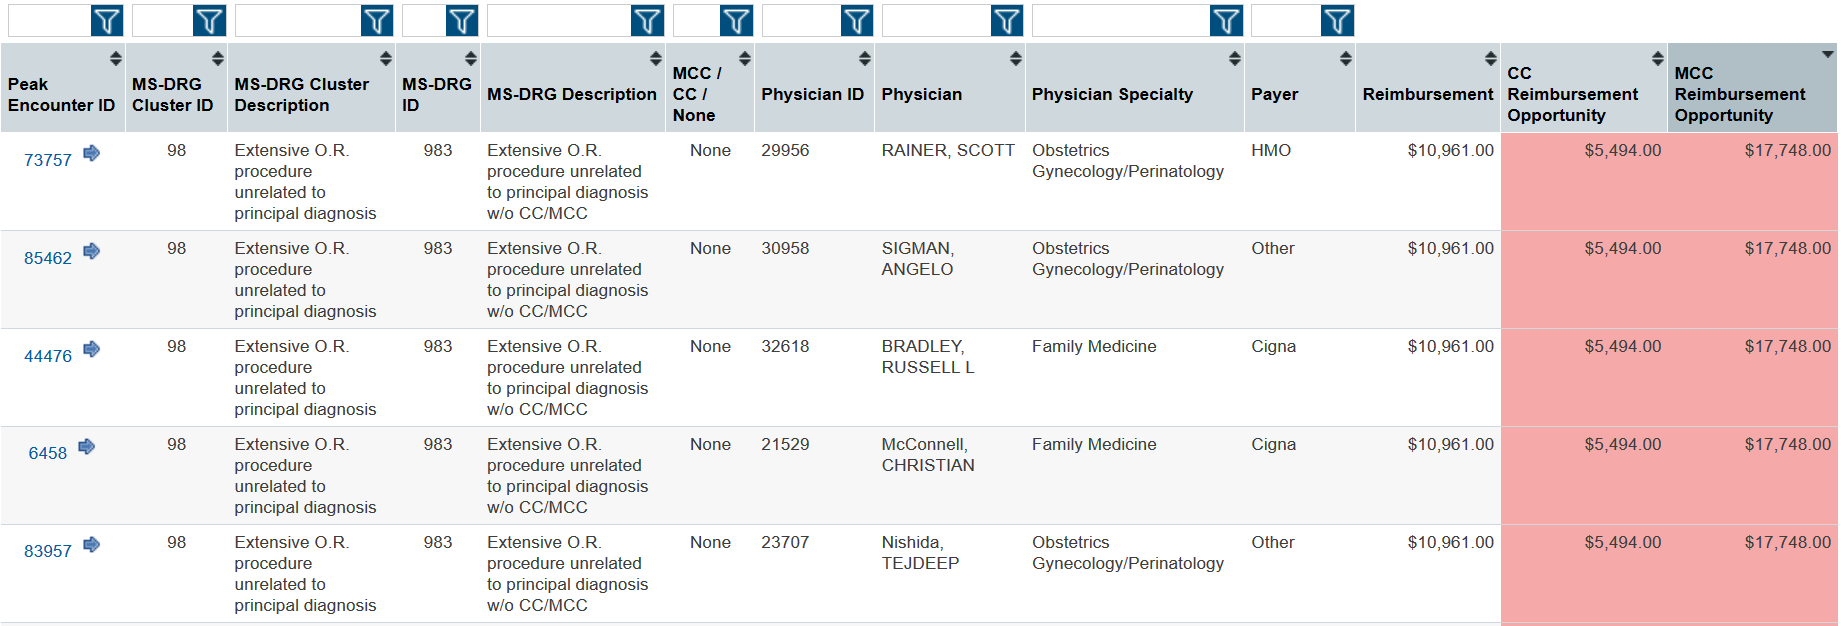
Patient Detail report
From the Diagnosis report, click the Report type dropdown and select the Patient Detail report to see individual cases in each MS-DRG cluster with MS-DRG and physician information.
Understand the data table
See the following sample data table.
Columns
| Column | Description |
|---|---|
| Clinical Analytics Encounter ID | The Clinical Analytics ID number for the encounter; click it to go to the patient’s Clinical Case Summary. |
| MS-DRG Cluster ID | Cluster ID number; see MS-DRG clusters for more information |
| MS-DRG Cluster Description | Cluster description |
| MS-DRG ID | MS-DRG ID number |
| MS-DRG Description | MS-DRG description |
| CC/MCC/None | Lists whether the MS-DRG has complications or comorbidities (CC), major complications or comorbidities (MCC), or neither |
| Physician ID | Physician’s ID number |
| Physician | Physician name |
| Physician Specialty | Physician specialty |
| Payer | Lists the payer for that particular case |
| Reimbursement | Lists the approximate reimbursement your facility can expect to get from Medicare for the case; note that this does not include reimbursement for outliers, special reimbursements, or cases that were discharged to home care, SNF, or another acute care facility that resulted in reimbursement reductions |
| CC Reimbursement Opportunity | Potential total reimbursement minus the current facility reimbursement; a red box means your facility is getting less reimbursement than the benchmark, and green means it is getting more reimbursement. In this case, this is the Reimbursement Opportunity if this patient had been coded CC, so patients with an MS-DRG with CC have a value of $0 here. |
| MCC Reimbursement Opportunity | Potential total reimbursement minus the current facility reimbursement; a red box means your facility is getting less reimbursement than the benchmark, and green means it is getting more reimbursement. In this case, this is the Reimbursement Opportunity if this patient had been coded MCC, so patients with an MS-DRG with MCC have a value of $0 here. |
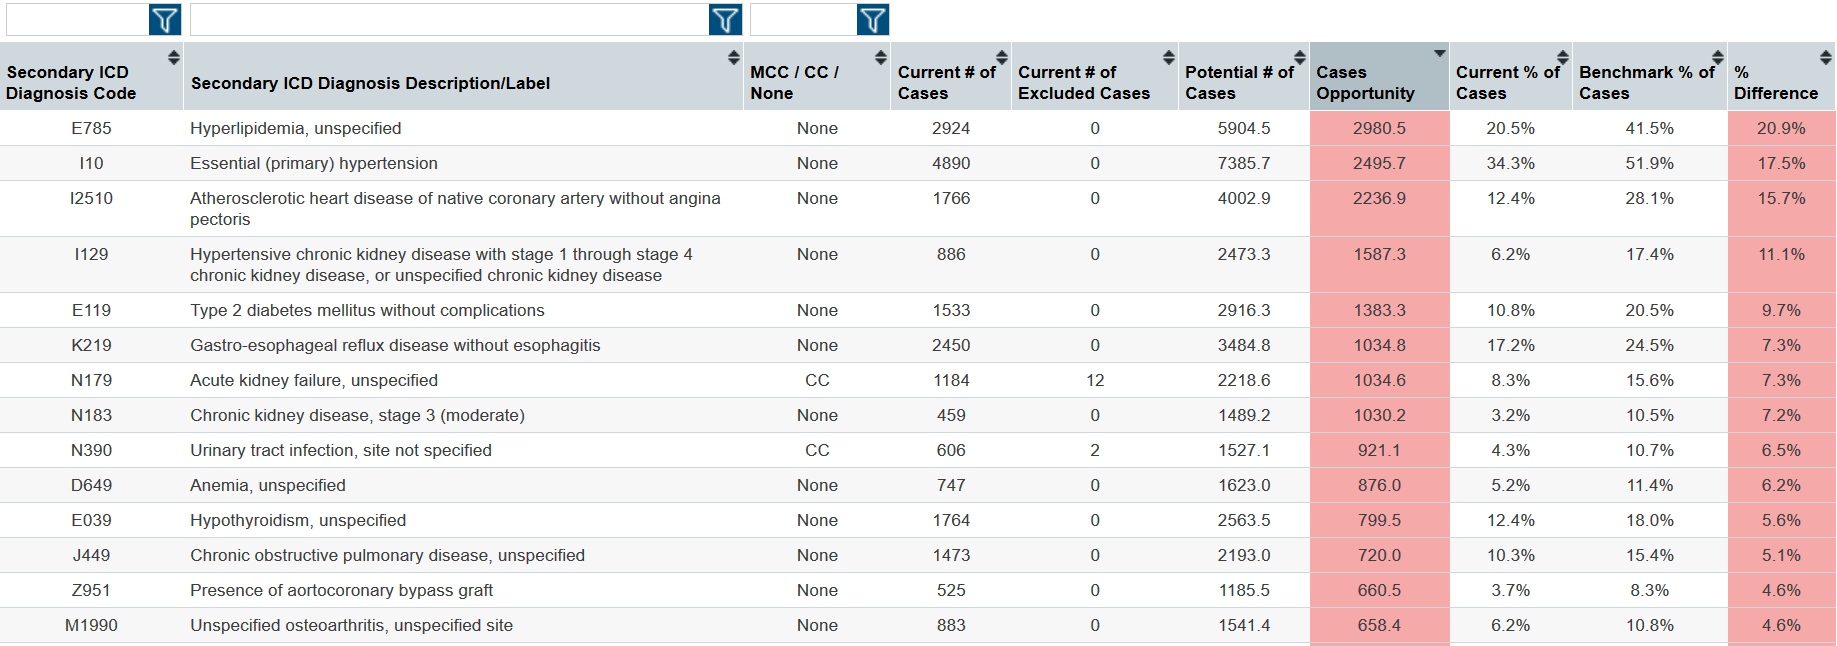
Overall Diagnosis report
You can switch to the Overall Diagnosis report from the dropdown in the Hospital-level report. The section loads an analysis showing cases grouped by secondary diagnosis across the whole hospital.
You can also reach this Report type by clicking a hyperlinked Secondary ICD Diagnosis Code from the Diagnosis report.
Understand the data table
Below is a sample data table.
NOTE: You cannot drill deeper from the Overall Diagnosis report.
Columns
| Column | Description |
|---|---|
|
Secondary ICD Diagnosis Code |
Secondary ICD Diagnosis Code |
|
Secondary ICD Diagnosis Code Description/Label |
Secondary ICD Diagnosis Code description |
|
MCC/CC/None |
Lists whether the secondary diagnosis has complications or comorbidities (CC), major complications or comorbidities (MCC), or neither |
|
Current # of Cases |
Number of encounters in the cluster with that particular secondary diagnosis code |
|
Current # of Excluded Cases |
Number of secondary diagnoses excluded because of the principal diagnosis code |
| Potential # of Cases | The benchmark number of cases with that particular secondary diagnosis code |
| Cases Opportunity | Potential # of Cases minus Current # of Cases |
|
Current % of Cases |
Shows what percentage of the cases consists of the specific secondary diagnosis for the facility |
|
Benchmark % of Cases |
Shows what percentage of the cases consists of the specific secondary diagnosis for the benchmark |
|
% Difference |
The difference between the Benchmark Percent of Cases and the Current Percent of Cases, displayed as a percent |
